My adventure into the world of blogging has been going for a week and a half now. I have a half-written how-to walking through how I setup this blog and now I’m working on this post (which will come out first). It will not be long before I’m a blogging expert! The one roadblock remaining is that this site has no favicon (at least prior to publishing this). This post aims to solve that problem. Once I have a favicon, I’ll really be a force in the blogging community. Unfortunately for me however, I’m not an artist and my wife is busy making a blanket. I’m okay at Python, so I’ll generate a favicon using that.
My idea is to generate my site’s favicon programmatically using a song as input. I will need to be able to read and parse an MP3 file and write an image one pixel at a time. I can use Pillow to generate the image but I’ll have to search around for something to parse an MP3 file in Python. It would be pretty easy to just open and read the song file’s bytes and generate an image with some logic from that, but I’d like to actually parse the song so that I can generate something from the music. Depending on what library I find, maybe I’ll do something with beat detection. When this is all said and done, you’ll be able to see the finished product on github. First, a few questions:
How big is the icon supposed to be?
Looks like when I try to add one to the site, WordPress tells me it should be at least 512×512 pixels.
Can I use Pillow to make an .ico file?
Yes, but that doesn’t matter because it looks like WordPress doesn’t use .ico files “for security reasons” that I didn’t bother looking into. I’ll be generating a .png instead.
Can I read/process .mp3 files in Python?
Of course! With librosa it seems.
Generating a .png file in Python
With all my questions from above answered, I can get right into the code. Let’s start with something simple; generating a red square one pixel at a time. We will need this logic because when we generate an image from a song, we’re going to want to make per-pixel decisions based on the song.
import numpy as np
from PIL import Image
from typing import Tuple

SQUARE_COLOR = (255, 0, 0, 255)  # Let's make a red square
ICON_SIZE = (512, 512)  # The recommended minimum size from WordPress


def generate_pixels(resolution: Tuple[int, int]) -> np.ndarray:
    """Generate pixels of an image with the provided resolution."""
    pixels = []

    # Eventually I'll extend this to generate an image one pixel at a time
    # based on an input song.
    for _row in range(resolution[1]):
        cur_row = []
        for _col in range(resolution[0]):
            cur_row.append(SQUARE_COLOR)
        pixels.append(cur_row)

    return np.array(pixels, dtype=np.uint8)


def main():
    """Entry point."""

    # For now, just make a solid color square, one pixel at a time,
    # for each resolution of our image.
    img_pixels = generate_pixels(ICON_SIZE)

    # Create the image from our multi-dimmensional array of pixels
    img = Image.fromarray(img_pixels)
    img.save('favicon.png', sizes=ICON_SIZE)


if __name__ == "__main__":
    main()
It worked! We have a red square!

Analyzing an MP3 file in Python
Since we’ll be generating the image one pixel at a time, we need to process the audio file and then be able to check some values in the song for each pixel. In other words, each pixel in the generated image will represent some small time slice of the song. To determine what the color and transparency should be for each pixel, we’ll need to decide what features of the song we want to use. For now, let’s use beats and amplitude. For that, we’ll need to write a Python script that:
- Processes an MP3 file from a user-provided path.
- Estimates the tempo.
- Determines for each pixel, whether it falls on a beat in the song.
- Determines for each pixel, the average amplitude of the waveform at that pixel’s “time slice”.
Sounds like a lot, but librosa is going to do all the heavy lifting. First I’ll explain the different parts of the script, then I’ll include the whole file.
librosa makes it really easy to read and parse an MP3. The following will read in and parse an MP3 into the time series data and sample rate.
>>> import librosa
>>> time_series, sample_rate = librosa.load("brass_monkey.mp3")
>>> time_series
array([ 5.8377805e-07, -8.7419551e-07,  1.3259771e-06, ...,
       -2.1545576e-01, -2.3902495e-01, -2.3631646e-01], dtype=float32)
>>> sample_rate
22050
I chose Brass Monkey by the Beastie Boys because I like it and it’s easy to lookup the BPM online for a well known song. According to the internet the song is 116 BPM. Let’s see what librosa says in our next code block where I show how to get the tempo of a song.
>>> onset_env = librosa.onset.onset_strength(time_series, sr=sample_rate)
>>> tempo = librosa.beat.tempo(onset_envelope=onset_env, sr=sample_rate)
>>> tempo[0]
117.45383523
Pretty spot-on! No need to test any other songs, librosa is going to work perfectly for what I need.
I know the size of the image is 512×512 which is 262,144 pixels in total, so we just need the song’s duration and then it’s simple division to get the amount of time each pixel will represent.
>>> duration = librosa.get_duration(filename="brass_monkey.mp3")
>>> duration
158.6
>>> pixel_time = duration / (512 * 512)
>>> pixel_time
0.000605010986328125
So, the song is 158.6 seconds long and each pixel in a 512×512 image will account for about 0.0006 seconds of song. Note: It would have also been possible to get the song duration by dividing the length of the time series data by the sample rate:
>>> len(time_series) / sample_rate
158.58666666666667
Either is fine. The division above is more efficient since the song file doesn’t need to be opened a second time. I chose to go with the helper function for readability.
Now, for each pixel we need to:
- Determine if that pixel is on a beat or not
- Get the average amplitude for all samples that happen within that pixel’s time slice
We’re only missing 2 variables to achieve those goals; beats per second and samples per pixel. To get the beats per second we just divide the tempo by 60. To get the whole samples per pixel we round down the result of the number of samples divided by the number of pixels.
>>> import math
>>> bps = tempo[0] / 60.0
>>> bps
1.9575639204545456
>>> samples_per_pixel = math.floor(len(time_series) / (512 * 512))
>>> samples_per_pixel
13
So, we have about 1.9 beats per second and each pixel in the image represents 13 samples. So we’ll be taking the average of 13 samples for each pixel to get an amplitude at that pixel. I could have also chosen to use the max, min, median, or really anything, the average is just what I decided to use.
I’m relying on the song being long enough that it has enough samples so that samples_per_pixel is at least 1. If it’s 0 we’ll need to print an error and quit. That would mean the song doesn’t have enough data to make the image. Now we have everything we need to loop over each pixel and check if it’s a “beat pixel” and get the average amplitude of the waveform for the pixel’s time slice.
>>> import numpy as np
>>> beats = 0
>>> num_pixels = 512 * 512
>>> avg_amps = []
>>> for pixel_idx in range(num_pixels):
...     song_time = pixel_idx * pixel_time
...     song_time = math.floor(song_time)
...     if song_time and math.ceil(bps) % song_time == 0:
...         beats += 1
...     sample_idx = pixel_idx * samples_per_pixel
...     samps = time_series[sample_idx:sample_idx + samples_per_pixel]
...     avg_amplitude = np.array(samps ).mean()
...     avg_amps.append(avg_amplitude)
...
>>> print(f"Found {beats} pixels that land on a beat")
Found 3306 pixels that land on a beat
>>>
The full script with comments, error handling, a command line argument to specify the song file, and a plot to make sure we did the average amplitude correctly is below:
import os
import sys
import math
import argparse
import librosa
import numpy as np
import matplotlib.pyplot as plt


def main():
    """Entry Point."""
    parser = argparse.ArgumentParser("Analyze an MP3")
    parser.add_argument(
        "-f", "--filename", action="store",
        help="Path to an .mp3 file", required=True)
    args = parser.parse_args()

    # Input validation
    if not os.path.exists(args.filename) or \
       not os.path.isfile(args.filename) or \
       not args.filename.endswith(".mp3"):
        print("An .mp3 file is required.")
        sys.exit(1)

    # Get the song duration
    duration = librosa.get_duration(filename=args.filename)

    # Get the estimated tempo of the song
    time_series, sample_rate = librosa.load(args.filename)
    onset_env = librosa.onset.onset_strength(time_series, sr=sample_rate)
    tempo = librosa.beat.tempo(onset_envelope=onset_env, sr=sample_rate)
    bps = tempo / 60.0  # beats per second

    # The image I'm generating is going to be 512x512 (or 262,144) pixels.
    # So let's break the duration down so that each pixel represents some
    # amount of song time.
    num_pixels = 512 * 512
    pixel_time = duration / num_pixels
    samples_per_pixel = math.floor(len(time_series) / num_pixels)
    print(f"Each pixel represents {pixel_time} seconds of song")
    print(f"Each pixel represents {samples_per_pixel} samples of song")

    # Now I just need 2 more things
    # 1. a way to get "beat" or "no beat" for a given pixel
    # 2. a way to get the amplitude of the waveform for a given pixel
    beats = 0
    avg_amps = []
    for pixel_idx in range(num_pixels):
        song_time = pixel_idx * pixel_time

        # To figure out if it's a beat, let's just round and
        # see if it's evenly divisible
        song_time = math.floor(song_time)
        if song_time and math.ceil(bps) % song_time == 0:
            beats += 1

        # Now let's figure out the average amplitude of the
        # waveform for this pixel's time
        sample_idx = pixel_idx * samples_per_pixel
        samps = time_series[sample_idx:sample_idx + samples_per_pixel]
        avg_amplitude = np.array(samps ).mean()
        avg_amps.append(avg_amplitude)

    print(f"Found {beats} pixels that land on a beat")

    # Plot the average amplitudes and make sure it still looks
    # somewhat song-like
    xaxis = np.arange(0, num_pixels, 1)
    plt.plot(xaxis, np.array(avg_amps))
    plt.xlabel("Pixel index")
    plt.ylabel("Average Pixel Amplitude")
    plt.title(args.filename)
    plt.show()


if __name__ == "__main__":
    main()
First Attempt
Right now we have 2 prototype python files complete. They can be found in the prototypes folder of the GitHub repository for this project (or above). Now we have to merge those two files together and write some logic for deciding what color a pixel should be based on the song position for that pixel. We’ll be able to basically throw away the prints and graph plot from mp3_analyzer.py and just keep the math and pixel loop which we can modify into a helper method and then jam it into our red_square.py script. We will also want to do some more error handling and command line options.
We’ll start with the pixel loop from mp3_analyzer.py. Let’s convert it into a SongImage class that takes a song path and image resolution, and does all the math to store the constants we need (beats per second, samples per pixel, etc.). The SongImage class will have a helper function that takes a pixel index as input and returns a tuple with 3 items. The first item in the returned tuple will be a boolean for whether or not the provided index falls on a beat or not. The second item will be the average amplitude of the song for that index. Finally, the third item will be the timestamp for that pixel.
class SongImage:
    """An object to hold all the song info."""

    def __init__(self, filename: str, resolution: Tuple[int, int]):
        self.filename = filename
        self.resolution = resolution
        #: Total song length in seconds
        self.duration = librosa.get_duration(filename=self.filename)
        #: The time series data (amplitudes of the waveform) and the sample rate
        self.time_series, self.sample_rate = librosa.load(self.filename)
        #: An onset envelop is used to measure BPM
        onset_env = librosa.onset.onset_strength(self.time_series, sr=self.sample_rate)
        #: Measure the tempo (BPM)
        self.tempo = librosa.beat.tempo(onset_envelope=onset_env, sr=self.sample_rate)
        #: Convert to beats per second
        self.bps = self.tempo / 60.0
        #: Get the total number of pixels for the image
        self.num_pixels = self.resolution[0] * self.resolution[1]
        #: Get the amount of time each pixel will represent in seconds
        self.pixel_time = self.duration / self.num_pixels
        #: Get the number of whole samples each pixel represents
        self.samples_per_pixel = math.floor(len(self.time_series) / self.num_pixels)

        if not self.samples_per_pixel:
            raise NotEnoughSong(
                "Not enough song data to make an image "
                f"with resolution {self.resolution[0]}x{self.resolution[1]}")

    def get_info_at_pixel(self, pixel_idx: int) -> Tuple[bool, float, float]:
        """Get song info for the pixel at the provided pixel index."""
        beat = False
        song_time = pixel_idx * self.pixel_time

        # To figure out if it's a beat, let's just round and
        # see if it's evenly divisible
        song_time = math.floor(song_time)
        if song_time and math.ceil(self.bps) % song_time == 0:
            beat = True

        # Now let's figure out the average amplitude of the
        # waveform for this pixel's time
        sample_idx = pixel_idx * self.samples_per_pixel
        samps = self.time_series[sample_idx:sample_idx + self.samples_per_pixel]
        avg_amplitude = np.array(samps ).mean()
        return (beat, avg_amplitude, song_time)
Now we have a useful object. We can give it a song file and image resolution and then we can ask it (for each pixel) if that pixel is on a beat and what the average amplitude of the waveform is for that pixel. Now we have to apply that information to some algorithm that will generate an image. Spoiler alert, my first attempt didn’t go well. I will leave it here as a lesson in what not to do.
def generate_pixels(resolution: Tuple[int, int], song: SongImage) -> np.ndarray:
    """Generate pixels of an image with the provided resolution."""
    pixels = []

    pixel_idx = 0
    for _row in range(resolution[1]):
        cur_row = []
        for _col in range(resolution[0]):
            # This is where we pick our color information for the pixel
            beat, amp = song.get_info_at_pixel(pixel_idx)
            r = g = b = a = 0
            if beat and amp > 0:
                a = 255
            elif amp > 0:
                a = 125

            amp = abs(int(amp))

            # Randomly pick a primary color
            choice = random.choice([0, 1, 2])
            if choice == 0:
                r = amp
            elif choice == 1:
                g = amp
            else:
                b = amp

            cur_row.append((r, g, b, a))
            pixel_idx += 1

        pixels.append(cur_row)

    return np.array(pixels, dtype=np.uint8)
I used the function above to generate the image by choosing the pixel transparency on each beat and then used the amplitude for the pixel color. The result? Garbage!

Well that didn’t go well. The image looks terrible, but it does at least make sense. If I zoom in, there’s quite a bit of repetition due to the fact that we tied transparency to the BPM. It’s also not colorful because we used the amplitude without scaling it up at all, so we ended up with RGB values that are all very low. We could scale the amplitude up to make it more colorful. We could also shrink the image resolution to see if a smaller image is more interesting, then scale it up to 512×512 to use as an icon. Another nit-pic I have about this whole thing is that I still ended up using random which kind-of defeats the purpose of generating an image from a song. Ideally a song produces mostly the same image every time.
Another option: we could throw it away and try something different. I’m not going to completely throw it away, but I had an idea I’d like to try to make a more interesting image. Right now we’re iterating over the image one pixel at a time and then choosing a color and transparency value. Instead, let’s move a position around the image flipping it’s direction based on the song input. This will be somewhat like how 2D levels in video games are procedurally generated with a “random walker” (like this).
Side Tracked! “Random Walk” Image Generation
Let’s make something simple to start. We can modify the red_square.py script to generate an image with red lines randomly placed by a “random walker” (a position that moves in a direction and the direction randomly changes after a number of pixels).
def walk_pixels(pixels: np.ndarray):
    """Walk the image"""
    pos = Point(0, 0)
    direction = Point(1, 0)  # Start left-to-right

    for idx in range(WIDTH * HEIGHT):
        if idx % 50 == 0:
            # Choose a random direction
            direction = random.choice([
                Point(1, 0),   # Left-to-right
                Point(0, 1),   # Top-to-bottom
                Point(-1, 0),  # Right-to-left
                Point(0, -1),  # Bottom-to-top
                Point(1, 1),   # Left-to-right diaganal
                Point(-1, -1)  # Right-to-left diaganal
            ])

        pixels[pos.x][pos.y] = NEW_COLOR

        check_pos = Point(pos.x, pos.y)
        check_pos.x += direction.x
        check_pos.y += direction.y

        # Reflect if we hit a wall
        if check_pos.x >= WIDTH or check_pos.x < 0:
            direction.x *= -1
        if check_pos.y >= HEIGHT or check_pos.y < 0:
            direction.y *= -1

        pos.x += direction.x
        pos.y += direction.y
It works! We have red lines!
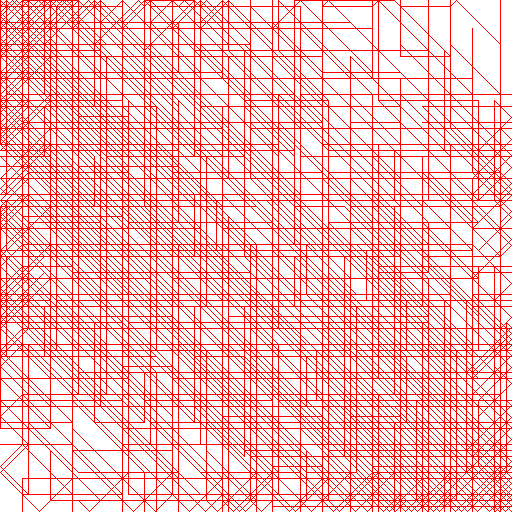
That’s a bit noisy though. Let’s see what we get from 32×32 and 64×64 by changing WIDTH and HEIGHT in the code above.


As we zoom in what we get is a bit more interesting and “logo-like”. Listen, I know it’s not gonna be a good logo, but I’ve written this much blog, I’m not about to admit this was a dumb idea. Instead I’m going to double down! One of the images that is produced by the end of this post will be the logo for this blog forever. I will never change it. We’re in it now! Buckle up! The full prototype “random walker” script can be found in the prototypes folder for the project on GitHub.
Back to business (wrap it up!)
To finish this up I just need to decide how the different features I’m pulling out of the song will drive the pixel walking code. Here’s what I’m thinking:
- The BPM will determine when the walker changes direction.
- The amplitude will have some effect on which direction we choose.
- We’ll use a solid pixel color for “no beat” and a different color for “beat”.
- We’ll loop to the other side of the image (like Asteroids) when we hit a wall.
- We’ll iterate as many pixels as there are in the image.
That seems simple enough and doesn’t require any randomness. We’ve basically already written all the code for this, it just needs to be combined, tweaked, and overengineered with a plugin system and about 100 different combinations of command line arguments to customize the resulting image. I’ll spare you all the overengineering, you’re free to browse the final project source code for that. For now I’ll just go over the key parts of what I’m calling the basic algorithm (my favorite one). NOTE: The code snippets in this section only contain the bits I felt were important to show and they do not have all the variable initializations and other code needed to run. See the finished project for full source.
Using the SongImage class from above, we provide a path to a song (from the command line) and a desired resulting image resolution (default 512×512):
# Process the song
song = SongImage(song_path, resolution)
Next, we modified our generate_pixels method from the red_square.py prototype to create a numpy.ndarray of transparent pixels (instead of red). As our walker walks around the image, the pixels will be changed from transparent to a color based on whether the pixel falls on a beat or not.
Finally, we implemented a basic algorithm loosely based on the rules above. In a loop from 0 to num_pixels we check the beat to set the color:
beat, amp, timestamp = song.get_info_at_pixel(idx)
if not beat and pixel == Color.transparent():
    pixels[pos.y][pos.x] = args.off_beat_color.as_tuple()
elif pixel == Color.transparent() or pixel == args.off_beat_color:
    pixels[pos.y][pos.x] = args.beat_color.as_tuple()
Then we turn 45 degrees clockwise if the amplitude (amp) is positive and 45 degrees counterclockwise if it’s negative (or 0). I added a little extra logic where, if the amplitude is more than the average amplitude for the entire song, the walker turns 90 additional degrees clockwise (or counterclockwise).
# Directions in order in 45 degree increments
directions = (
    Point(1, 0), Point(1, 1), Point(0, 1),
    Point(-1, 1), Point(-1, 0), Point(-1, -1),
    Point(0, -1), Point(1, -1)
)

# Try to choose a direction
if amp > 0:
    turn_amnt = 1
else:
    turn_amnt = -1

direction_idx += turn_amnt

# Turn more if it's above average
if amp > song.overall_avg_amplitude:
    direction_idx += 2
elif amp < (song.overall_avg_amplitude * -1):
    direction_idx -= 2

direction_idx = direction_idx % len(directions)

# Update the current direction
direction = directions[direction_idx]
Then we update the position of the walker to the next pixel in that direction. If we hit the edge of the image, we loop back around to the other side like the game Asteroids.
# Create a temporary copy of the current position to change
check_pos = Point(pos.x, pos.y)
check_pos.x += direction.x
check_pos.y += direction.y

# Wrap if we're outside the bounds
if check_pos.x >= resolution.x:
    pos.x = 0
elif check_pos.x < 0:
    pos.x = resolution.x - 1

if check_pos.y >= resolution.y:
    pos.y = 0
elif check_pos.y < 0:
    pos.y = resolution.y - 1
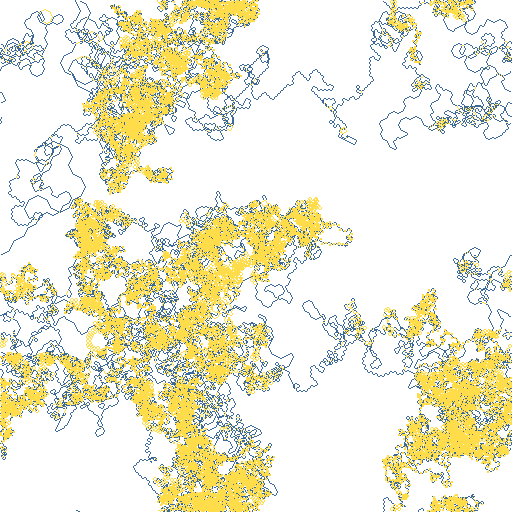
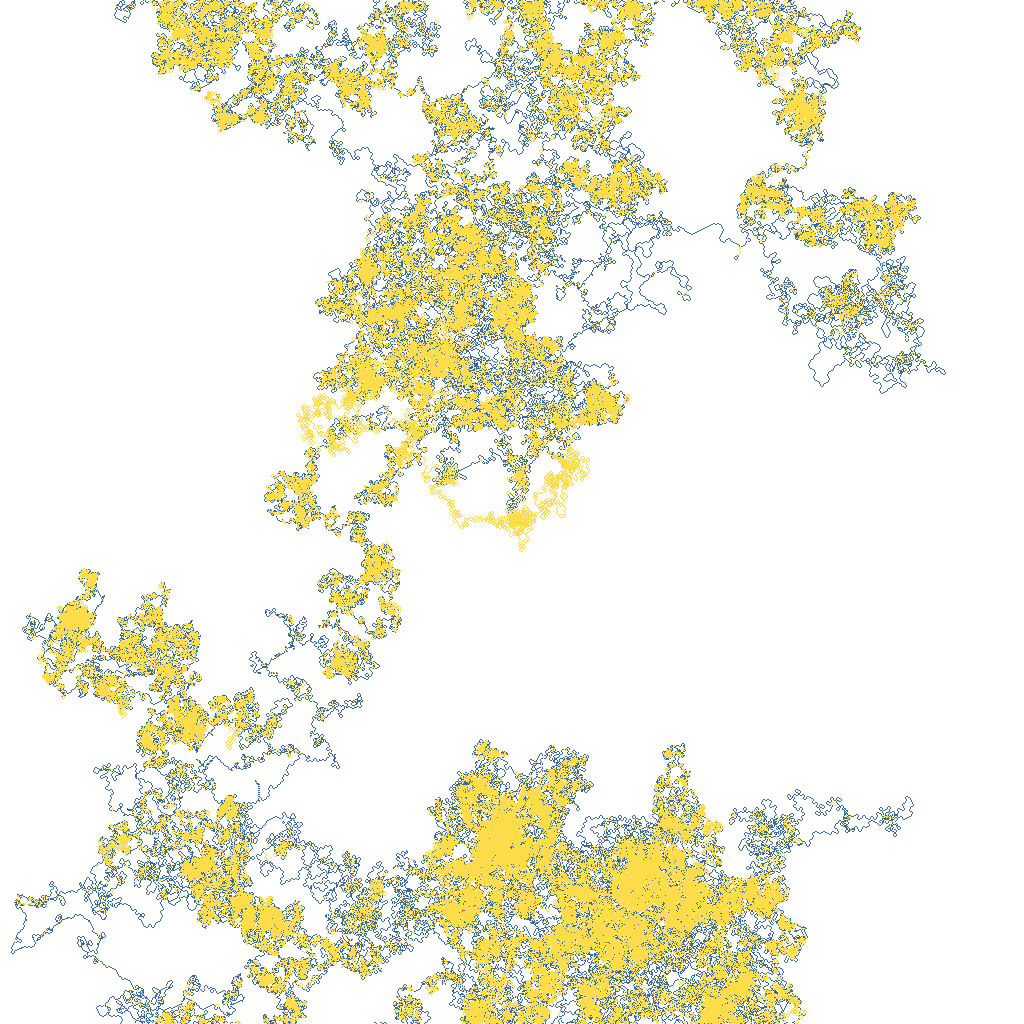
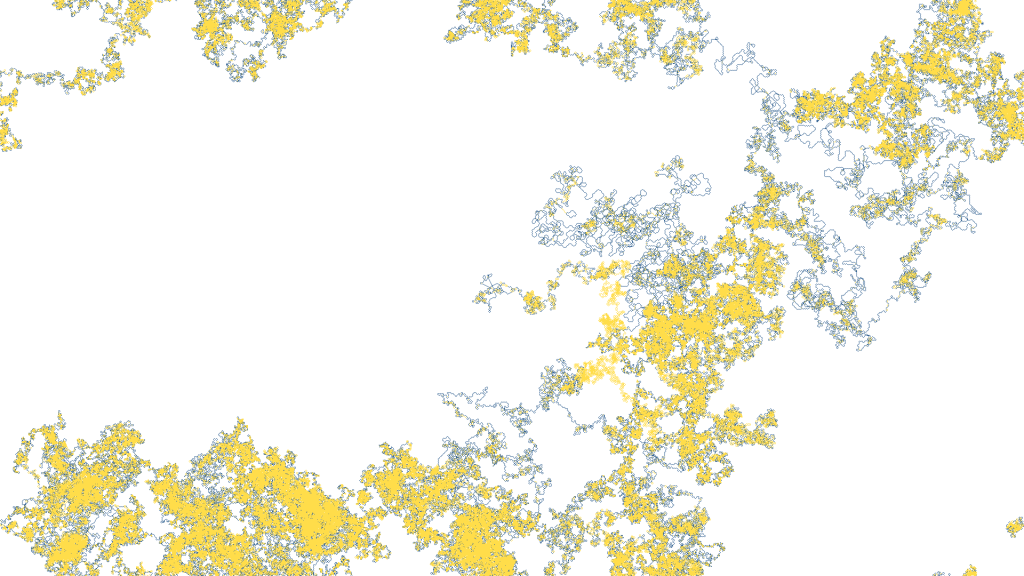
If you run all of that against “Brass Monkey” by the Beastie Boys you end up with the following images (I found higher resolutions looked better):
Gallery
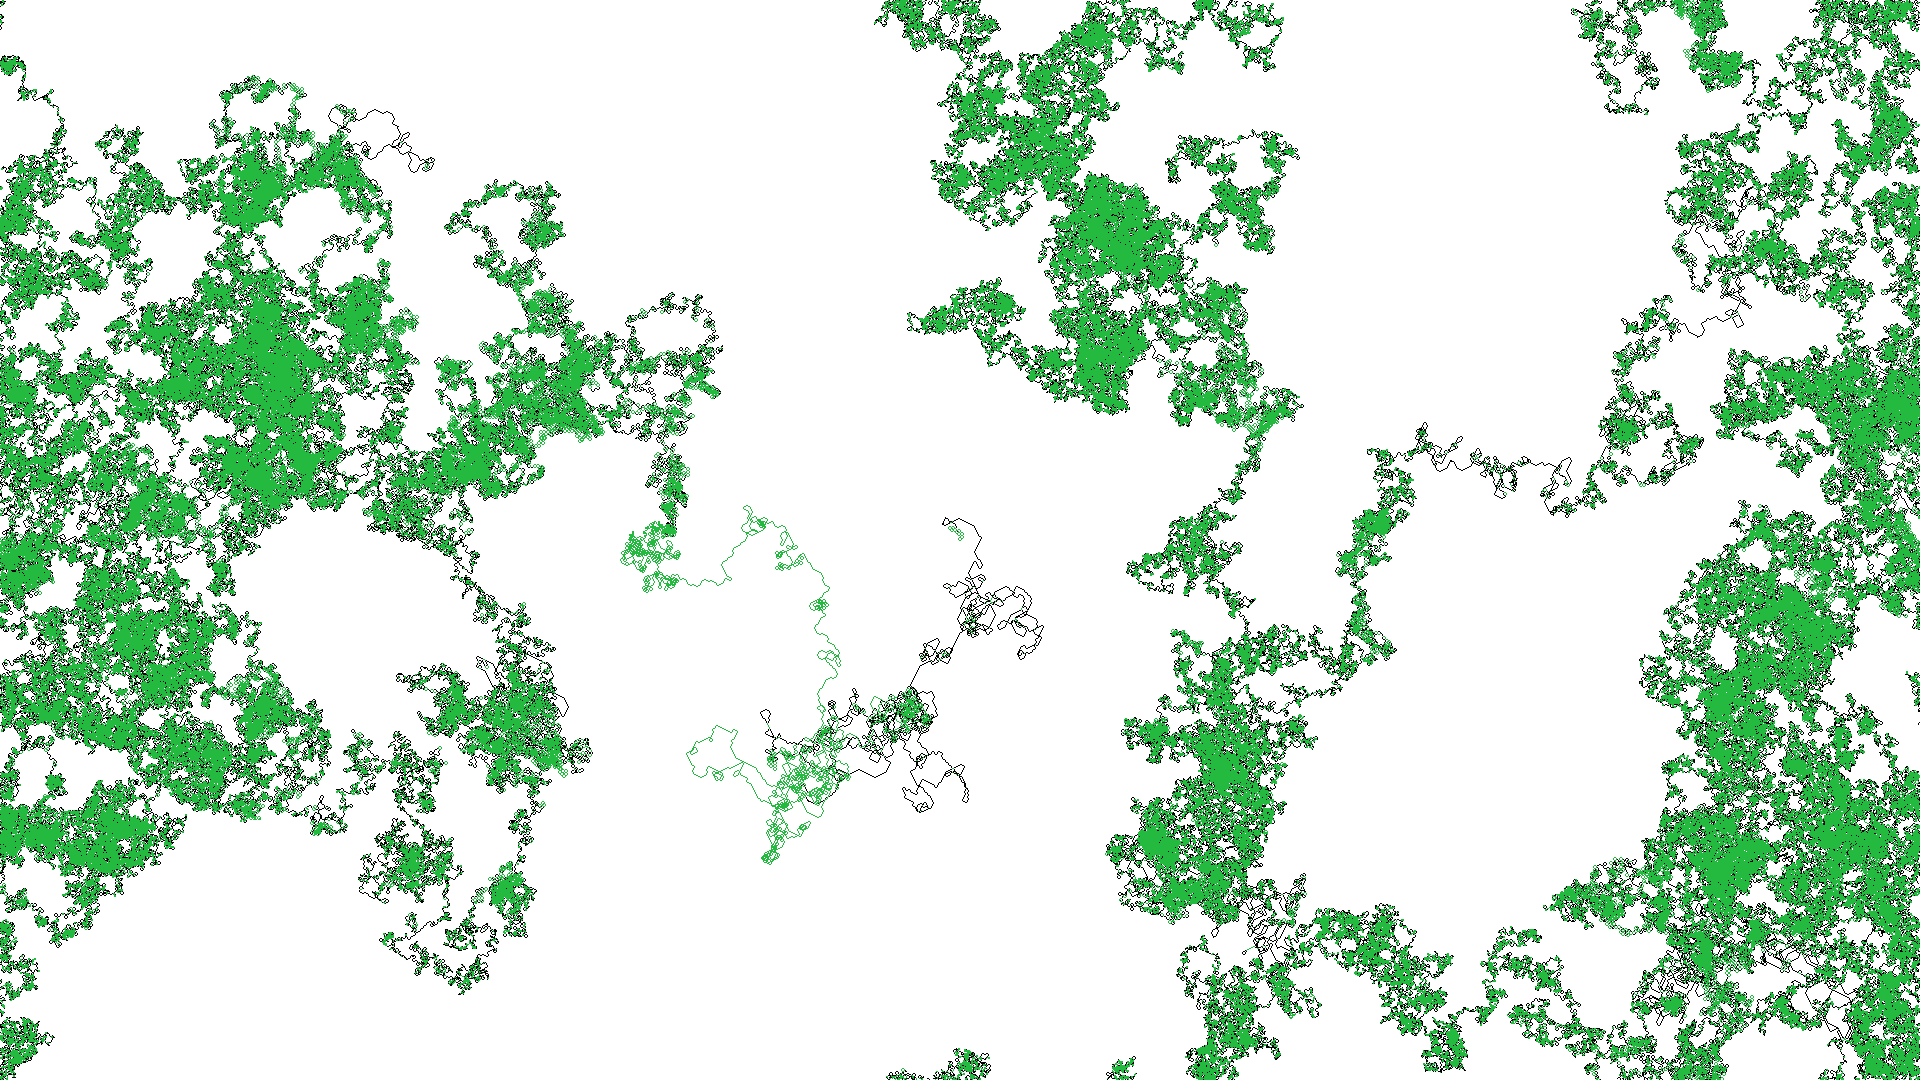
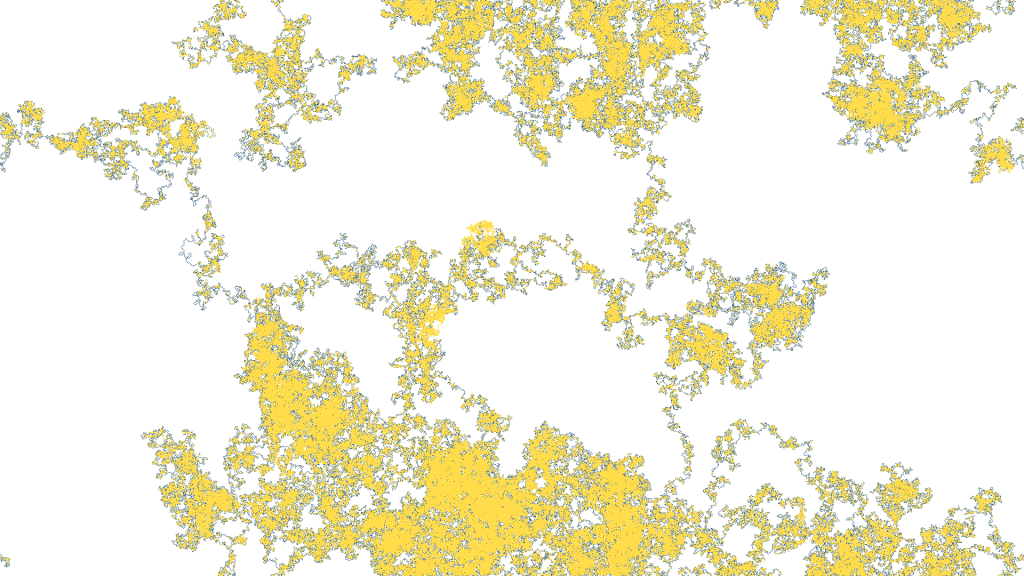
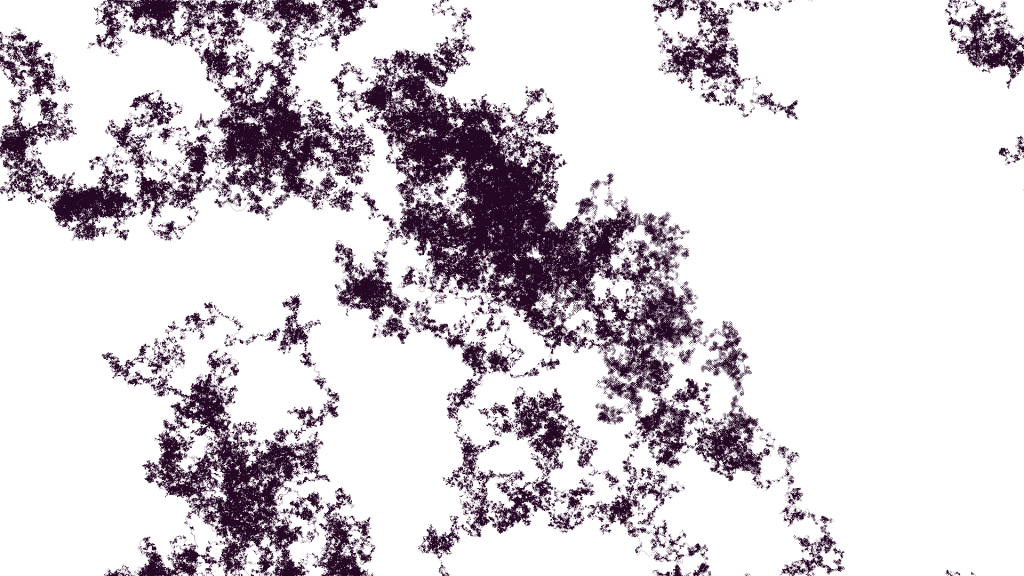
Here’s a gallery of some of my favorites from some other songs. I changed the colors around to experiment with what looks best. I landed on matrix colors (green/black) because I’m a nerd and I don’t know how to art, with the exception of Symphony of Destruction by Megadeth, for that I used colors from the album artwork.
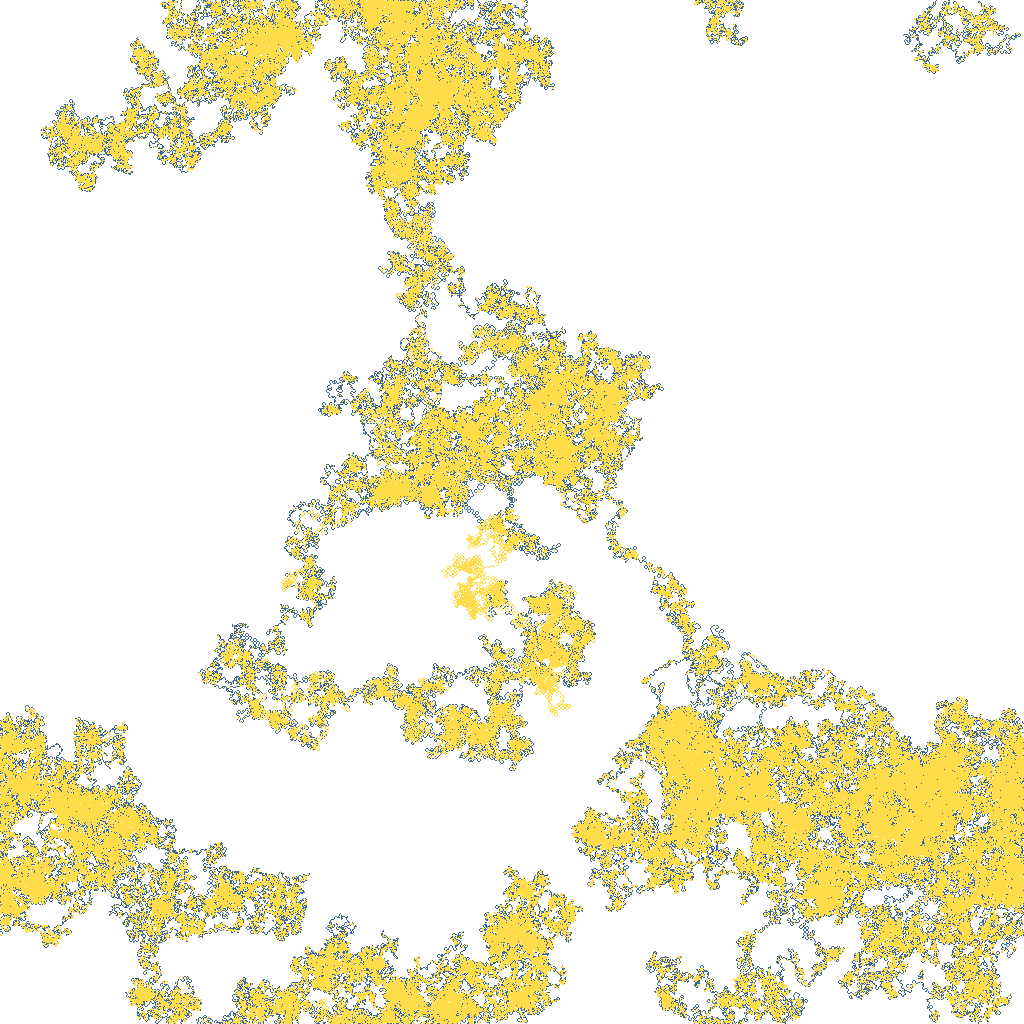
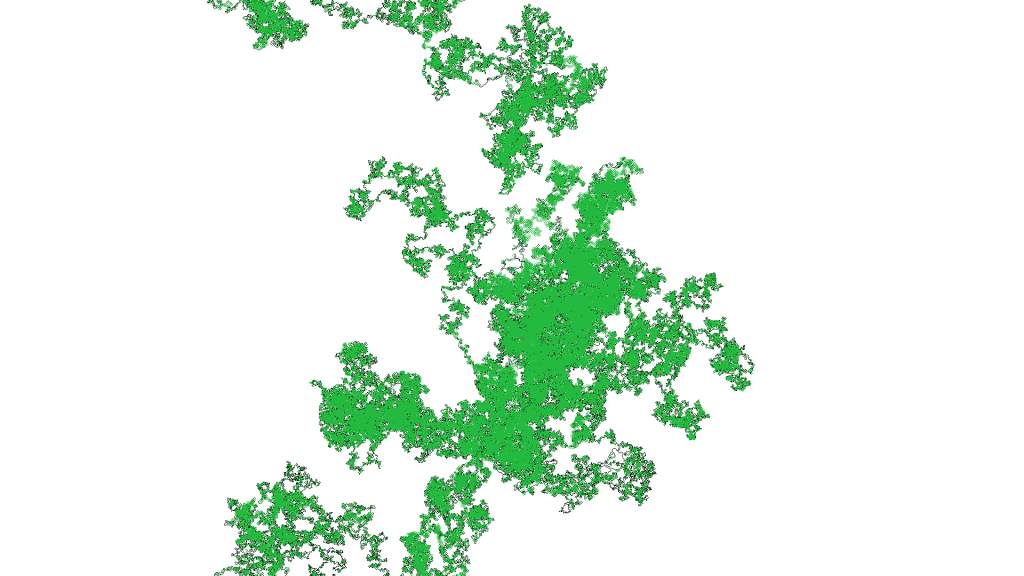
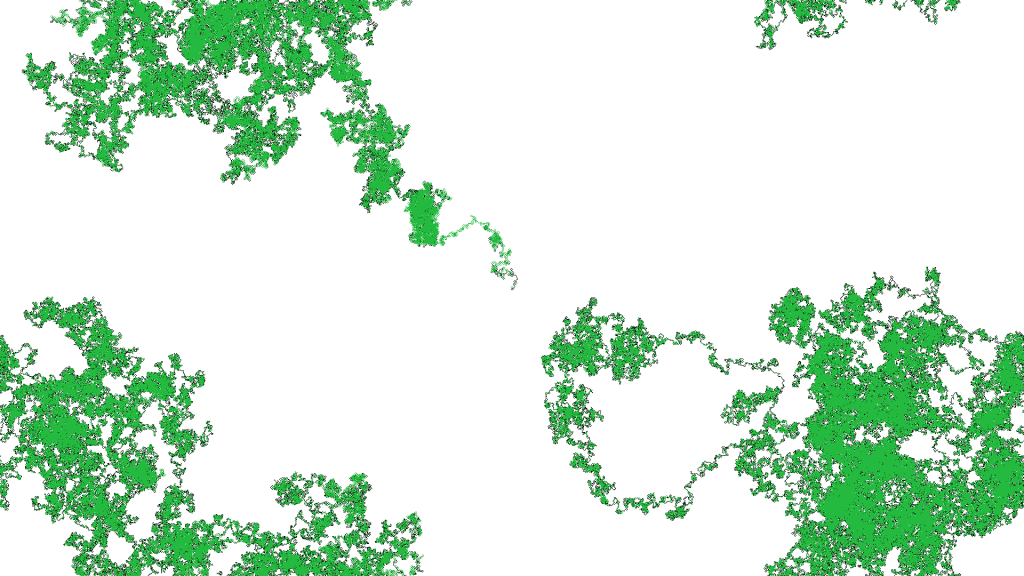
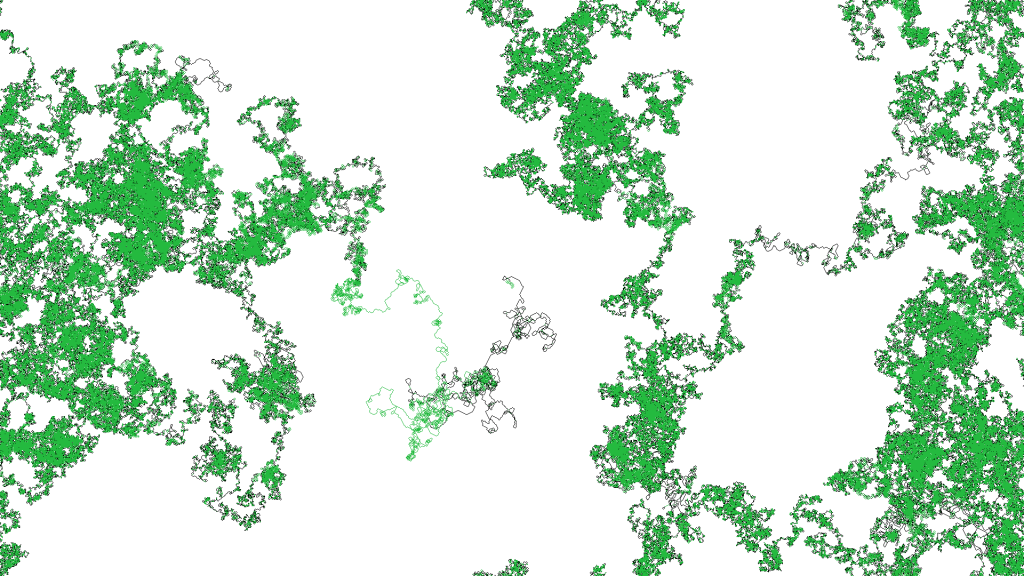
For the site icon, I decided to crop what looks like some sort of yelling monster with its arms waving in the air out of the 1920×1080 image generated from The Double Helix of Extinction by Between the Buried and Me.
Extra Credit – Make a live visualizer out of it
While looking at all these images I couldn’t help but wonder what part of different songs caused the walker to go a certain direction. So I decided to take a stab at writing a visualizer that would play the song while drawing the image in real time. My first attempt at it was to use the builtin Python Tk interface, tkinter, but that quickly got messy since I’m trying to set individual pixel values and I want to do it as quickly as possible. There are certainly ways I could have done this even better and more efficiently, but I decided to use Processing to get the job done. The final sketch can be found in the GitHub repository for this project under the mp3toimage_visualizer directory.
To start, I needed a way to get the image generation information over to Processing. To do that, I made a modification to the Python image generator to save off information for each pixel we set in the image. I had to save the position of the pixel, the color, and the timestamp in the song for when the pixel was changed:
pixel_changed = False
if not beat and pixel == Color.transparent():
    pixels[pos.y][pos.x] = args.off_beat_color.as_tuple()
    pixel_changed = True
elif pixel == Color.transparent() or pixel == args.off_beat_color:
    pixels[pos.y][pos.x] = args.beat_color.as_tuple()
    pixel_changed = True

if pixel_changed and pb_list is not None:
    pb_list.append(PlaybackItem(
        pos,
        Color.from_tuple(pixels[pos.y][pos.x]),
        timestamp,
        song.pixel_time))
One important optimization was skipping any pixel we already set. The walker does tons of back tracking over pixels that have already been set. It was so much that the code I wrote in Processing couldn’t keep up with the song. Skipping pixels already set was the easiest way to optimize.
Once I had the list of pixels and timestamps, I wrote them to a CSV file along with the original song file path and image resolution. After that, the Processing sketch was pretty simple. The most complicated parts, excluded here, were dealing with allowing user selection of the input file. The sketch reads in the CSV produced by the Python script and then draws the pixels based on the song’s playback position. The following snippet is from the draw method which is called once per frame.
if (pbItems.size() == 0) {
    return;
}

// Get the song's current playback position
float songPos = soundFile.position();

int count = 0;

// Get the first item
PlaybackItem item = pbItems.get(0);
while(pbItems.size() > 0 && item.should_pop(songPos)) {
    // Loop over each item who's timestamp is less than
    // or equal to the song's playback position (this is
    // more "close enough" than exact).
    item = pbItems.get(0);
    item.display();  // Display it
    pbItems.remove(0);  // Remove it from the list
    count++;
}
if (count >= 1000) {  // Over 1000 per frame and we fall way behind
    println("TOO MUCH DATA. Drawing is likely to fall behind.");
}
I think that about wraps it up. There’s a whole README and all that good stuff over in the GitHub repository for the project, so if you’re curious what one of your favorite songs looks like as an image, or if you want to mess around with the different algorithms and command line options that I didn’t go into here, go run it for yourself and let me know how it goes. Or don’t. #GreatJob!
References
- https://code-maven.com/create-images-with-python-pil-pillow
- https://stackoverflow.com/questions/9458480/read-mp3-in-python-3
- https://librosa.org/doc/latest/index.html
- https://songbpm.com/@beastie-boys/brass-monkey
- https://librosa.org/doc/latest/generated/librosa.beat.tempo.html#librosa.beat.tempo
- https://processing.org/
